Salesforce - PhoneIQ Agent Performance Dashboard
Learn how to read and personalize your Agent Dashboard.
Updated on April 6, 2022
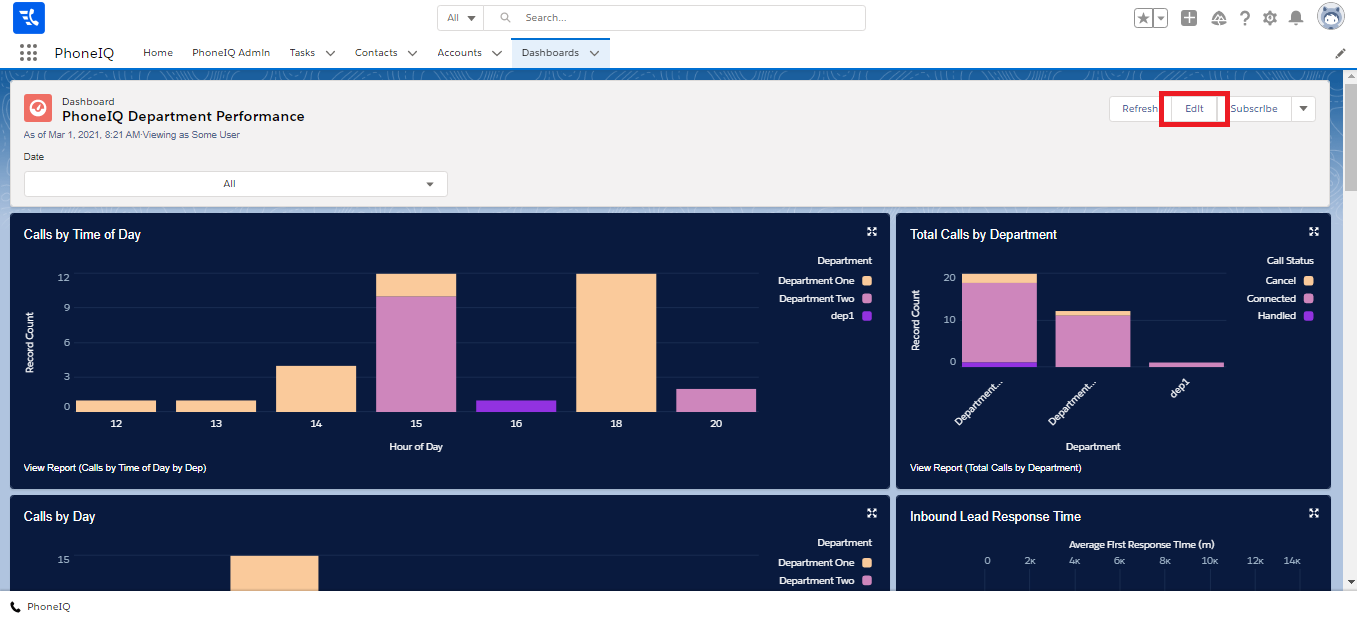
PhoneIQ Dashboards let you see reports of in- and outbound calls. This article will go over the Agent Performace Dashboard (see also a full list of our dashboards).
Step 1: Follow the steps at 'PhoneIQ Dashboards - Salesforce Reports' and access the 'PhoneIQ Agent Performance' dashboard.

Step 2: On there, you will see all PhoneIQ's reports for your agents.
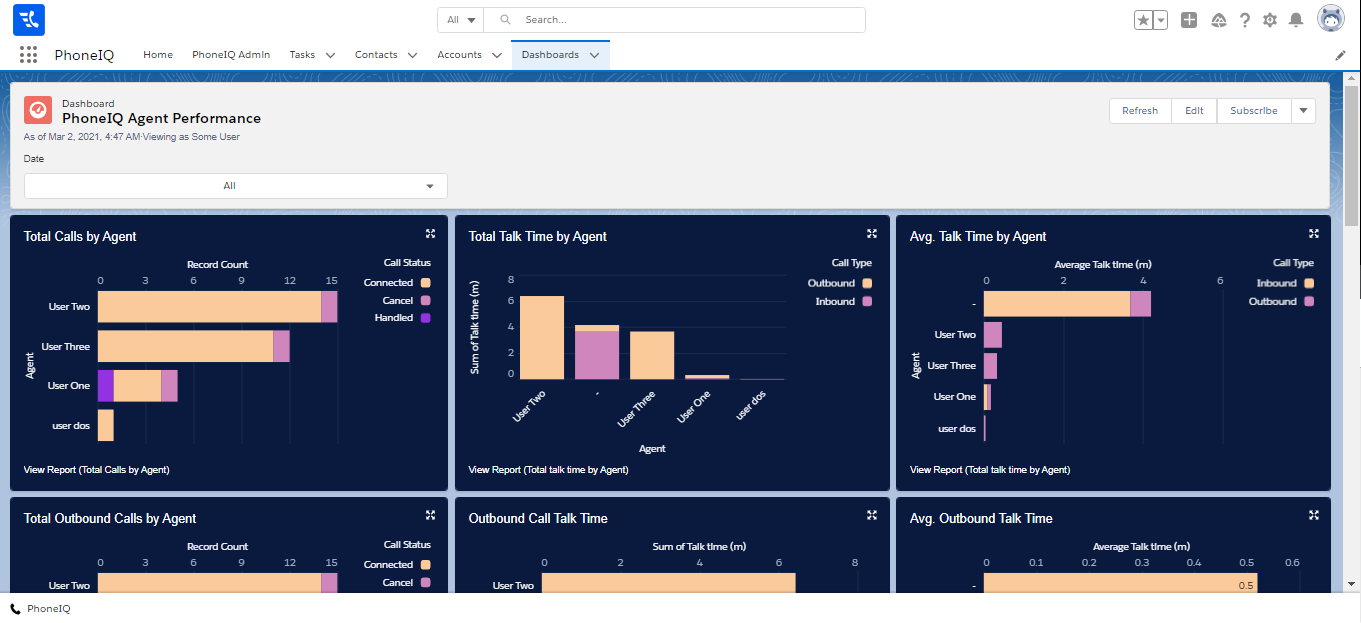
Understanding Reports
Here is a comprehensive list of every report on the dashboard:
- Total Calls by Agent: Groups calls according to the agent of the underlying tasks. Then it stacks the count by call status.
- Total Talk Time by Agent: Groups the total talk time according to the agent of the underlying tasks. Then it stacks the total by call type (outbound/inbound).
- Avg. Talk Time by Agent: Groups the average total talk time according to the agent of the underlying tasks. Then it stacks the total by call type (outbound/inbound).
- Total Outbound Calls by Agent: Groups outbound calls according to the agent of the underlying tasks. Then it stacks the count by call status.
- Outbound Talk Time: Groups the total talk time of outbound calls according to the agent of the underlying tasks.
- Avg. Outbound Talk Time: Groups the average total talk time of outbound calls according to the agent of the underlying tasks.
- Total Inbound Calls by Agent: Groups inbound calls according to the agent of the underlying tasks. Then it stacks the count by call status.
- Inbound Talk Time: Groups the total talk time of inbound calls according to the agent of the underlying tasks.
- Avg. Inbound Talk Time: Groups the average total talk time of inbound calls according to the agent of the underlying tasks.
- Inbound Lead Response Time: This shows the average response time (in minutes) for inbound leads, and groups it by lead owner. You can change your definition for an "inbound lead" on the report.
- Pitch Success by Agent: Groups connected calls according to the agent of the underlying tasks. Then it stacks the count depending on the duration of the calls:
0-39 -> Unsuccessful
40-119 -> Partially successful
119 -> Successful
- Call Purpose by Agent: Groups calls according to the agent of the underlying tasks. Then it stacks the count by call purpose.
- Call Tags by Agent: Groups calls according to the agent of the underlying tasks. Then it stacks the count by call tag.
- Caller Mood by Agent: Groups calls according to the agent of the underlying tasks. Then it stacks the count by caller mood.
- Call Result by Agent: Groups calls according to the agent of the underlying tasks. Then it stacks the count by call result.
- Call to Connect Rate by Agent: It shows how many calls connected over the total of outbound calls, grouped by agent, in percentage.
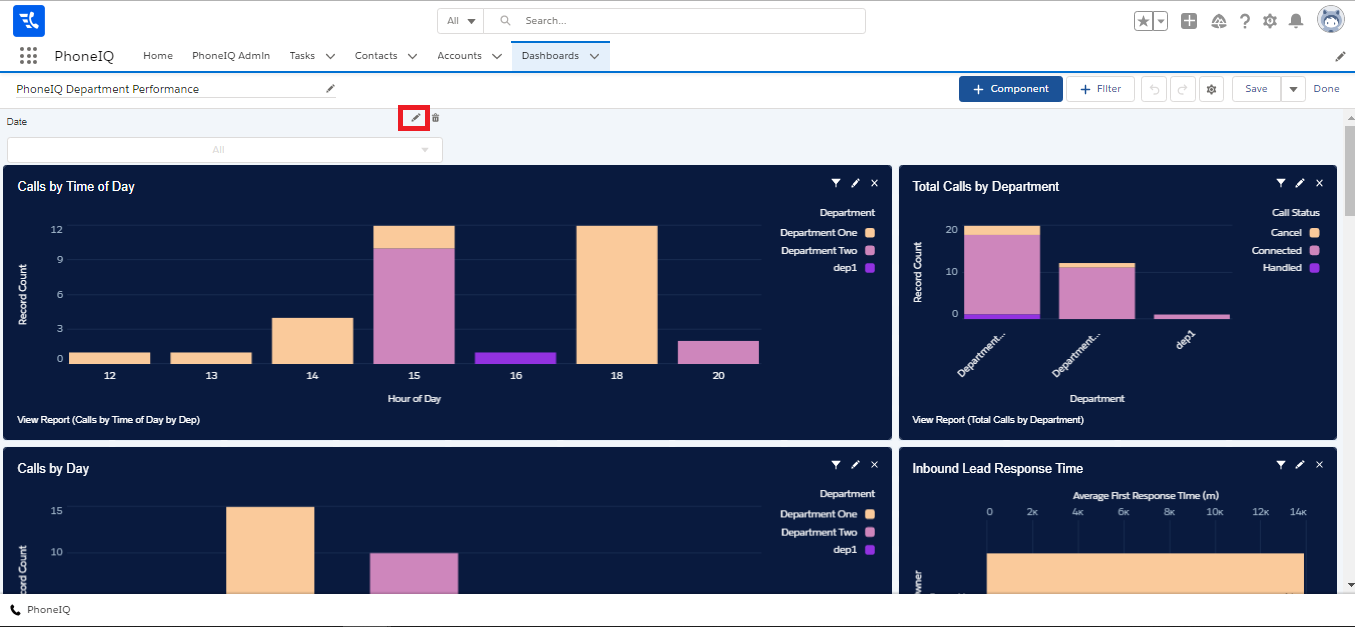
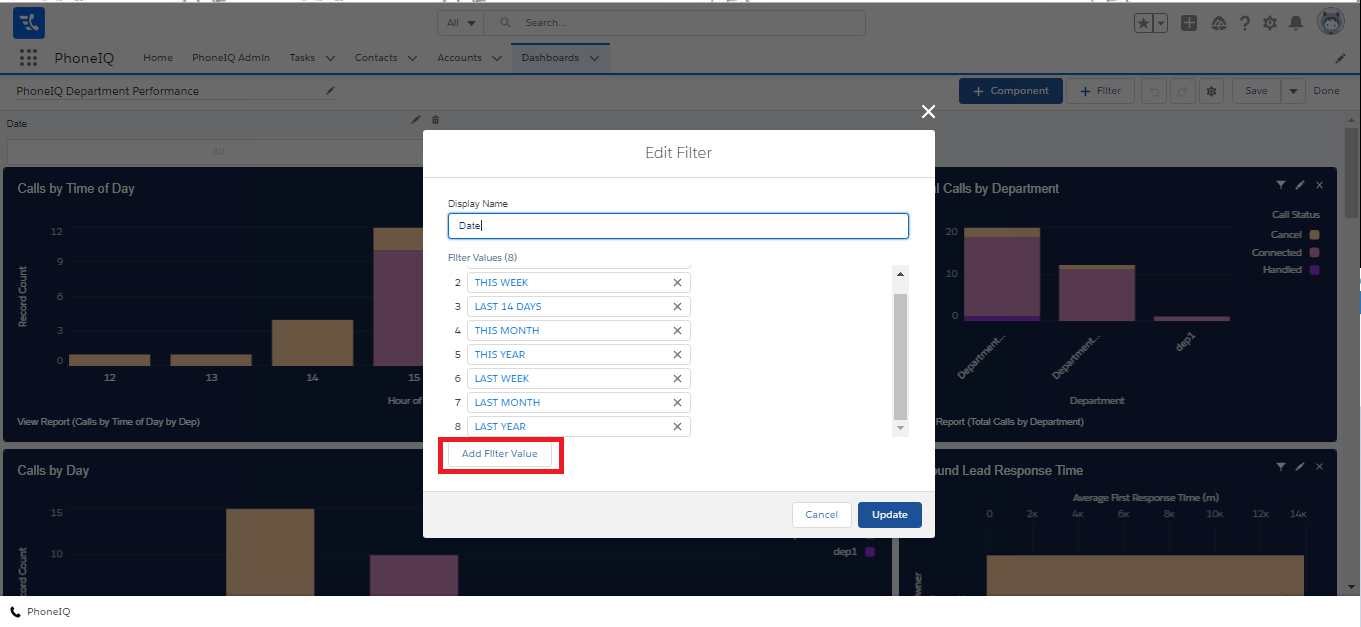
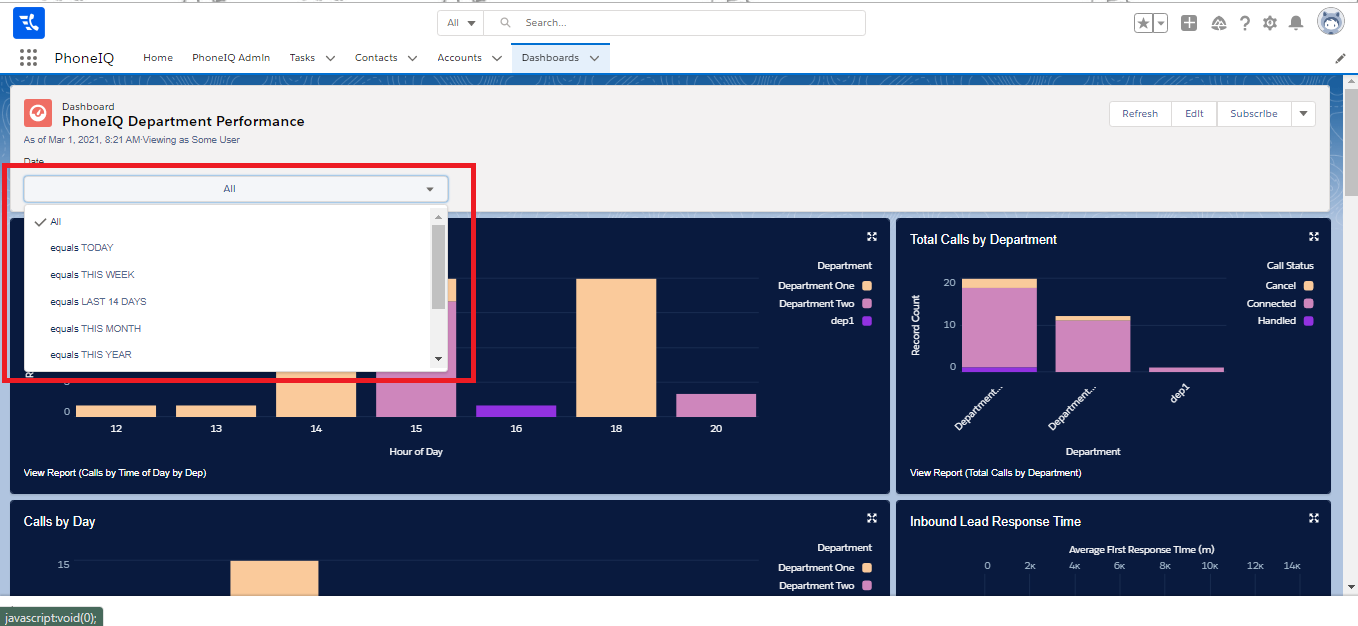
Changing Filters
You can select one of the predefined date filters to limit the tasks taken into account for the reports.
NOTE: When making changes to our default dashboards/reports, we highly recommend to 'Save As' first.
To change the dates or add a new filter, you have to go to 'Edit,'
and once there, go to 'Filters,' to add a new filter,
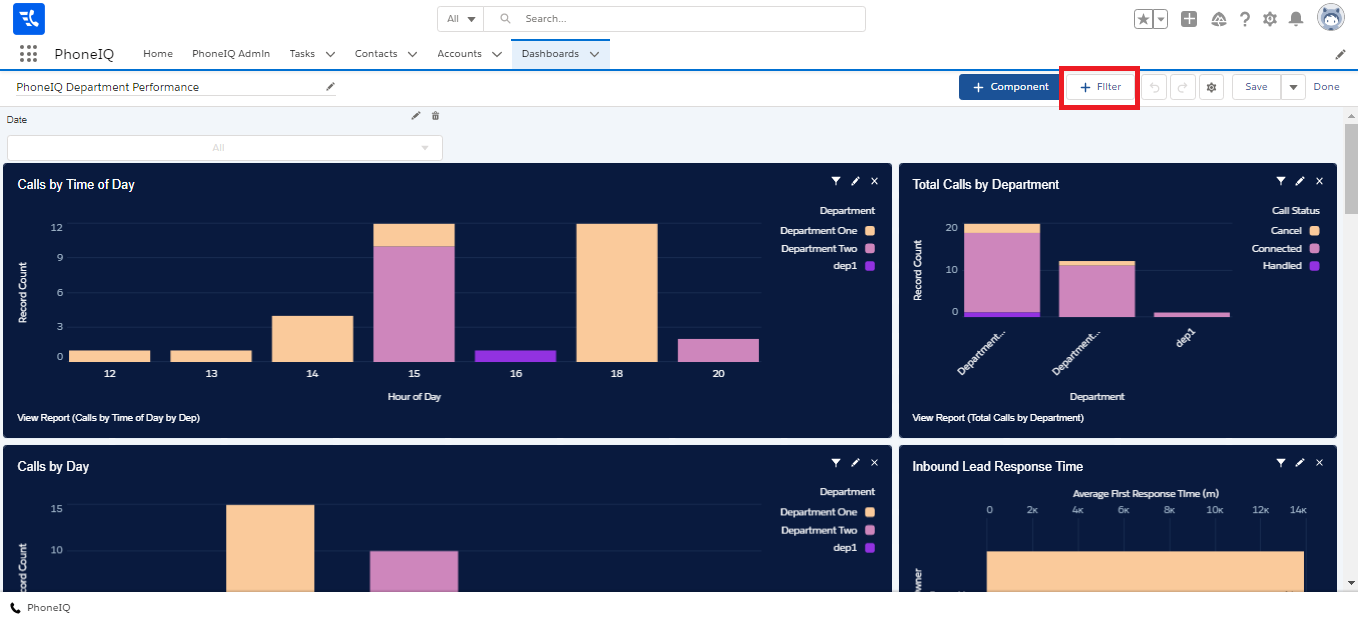
or to the pencil icon at 'Date' to change or add to the default date values.